
Innovation Vista’s annual benchmark estimates the share of mid-market companies ($10M–$1B in revenue) across 18 industries that have reached Stabilized, Optimized, and Monetized maturity across three dimensions; Data, Business Intelligence, and Artificial Intelligence. The 2026 edition utilizes v2 of an AI-powered methodology designed for transparency, auditability, and honest treatment of what synthesis from public signals can and cannot tell us.
This cross-industry report presents the headline findings.
Headline finding · the mid-market trails enterprise competition by a structural margin
For organizations over $1B in revenue, the 2026 benchmark found enterprise midpoints of 53% (Data Monetized), 50% (BI Monetized), and 20% (AI Monetized) as calibration targets. Observed mid-market means came in materially below those references:
| Dimension | Enterprise competition | Mid-market observed | Gap |
|---|---|---|---|
| Data Monetized | 53% | 44.4% | -8.6 pts |
| BI Monetized | 50% | 43.5% | -6.4 pts |
| AI Monetized | 20% | 16.9% | -3.1 pts |
The 2026 mid-market analytics maturity story is not how close mid-market companies have come to enterprise practice; it is how persistent the lag remains despite a decade of platform commoditization. Cloud data warehouses, dashboarding tools, and AI APIs are now available to any organization with a credit card. The structural drivers (talent density, governance bandwidth, capital allocation discipline) explain more of the gap than technology access does.
The leaderboard · two industries lead all others across three dimensions
| Rank | Data Monetized | BI Monetized | AI Monetized |
|---|---|---|---|
| 1 | Retail (54.7) | Healthcare (53.7) | Retail (39.7) |
| 2 | Manufacturing (53.7) | Financial Services (52.3) | Entertainment & Media (29.3) |
| 3 | Insurance (52.0) | Retail (52.3) | Tourism (22.3) |
| 4 | Utilities (50.0) | Manufacturing (51.3) | Insurance (19.3) |
| 5 | Energy / Oil & Gas (48.7) | Entertainment & Media (50.0) | Energy / Oil & Gas (18.7) |
Retail is the only industry that leads two dimensions. Healthcare leads BI because value-based care contracts force dashboard signal into operational decisions. Retail leads AI because consumer-facing personalization, dynamic pricing, and demand forecasting carry tight, measurable revenue feedback loops with minimal regulatory friction. Tourism‘s #3 AI position is the most counter-intuitive number in the report; it earns its place through ML-driven pricing and recommendation engines that don’t require committee review.
Composite ranking · Retail dominates, Real Estate trails
Averaging Data, BI, and AI Monetized scores produces a composite:
| Rank | Industry | Composite Monetized Score |
|---|---|---|
| 1 | Retail | 48.9 |
| 2 | Entertainment & Media | 41.3 |
| 3 | Manufacturing | 40.7 |
| 4 | Insurance | 40.3 |
| 5 | Healthcare | 39.0 |
| 6 | Financial Services | 38.3 |
| 7 | Energy / Oil & Gas | 38.2 |
| 8 | Aerospace | 37.1 |
| 9 | Business & Professional Services | 34.6 |
| 10 | Private Equity portfolio companies | 34.0 |
| 11 | Utilities | 33.9 |
| 12 | Agriculture & Food Service | 32.5 |
| 13 | Legal Services | 32.3 |
| 14 | Tourism | 30.6 |
| 15 | Education | 29.8 |
| 16 | Logistics & Transportation | 27.8 |
| 17 | Real Estate | 25.4 |
| 18 | Commercial Real Estate | 24.3 |
The seven leaders are industries with either consumer-facing competitive pressure (Retail, E&M), capital-intensive operational ROI (Manufacturing, Energy, Aerospace), or compliance-driven infrastructure investment (Insurance, Healthcare, Financial Services). The bottom four are industries where data fragmentation, fee-structure economics, or asset-heavy business models slow analytics monetization regardless of platform access.
The monetization gap · where infrastructure is built but value isn’t extracted
The most actionable cross-industry pattern in the 2026 data is the Stabilized-to-Monetized spread; how far each industry has progressed along the Stabilize → Optimize → Monetize curve. A wide spread indicates an industry that has built infrastructure (warehouses, dashboards, AI pilots) without yet extracting measurable value.
The six industries with the widest gap (Logistics, Commercial Real Estate, Legal Services, Tourism, Real Estate, Entertainment & Media) have all built foundational capability but face binding constraints on the path to monetization; data fragmentation in Logistics and Real Estate, regulatory caution in Legal Services, organizational silos in Tourism, IP governance complexity in Entertainment & Media.
The four industries with the narrowest gap (Retail, Manufacturing, Financial Services, Healthcare) have all moved further along the curve; Retail through consumer-facing competitive necessity, Manufacturing through operational ROI on predictive maintenance and yield, Financial Services through regulatory and risk modeling pressure, and Healthcare through value-based care contracts that force dashboard signal into operational decisions.
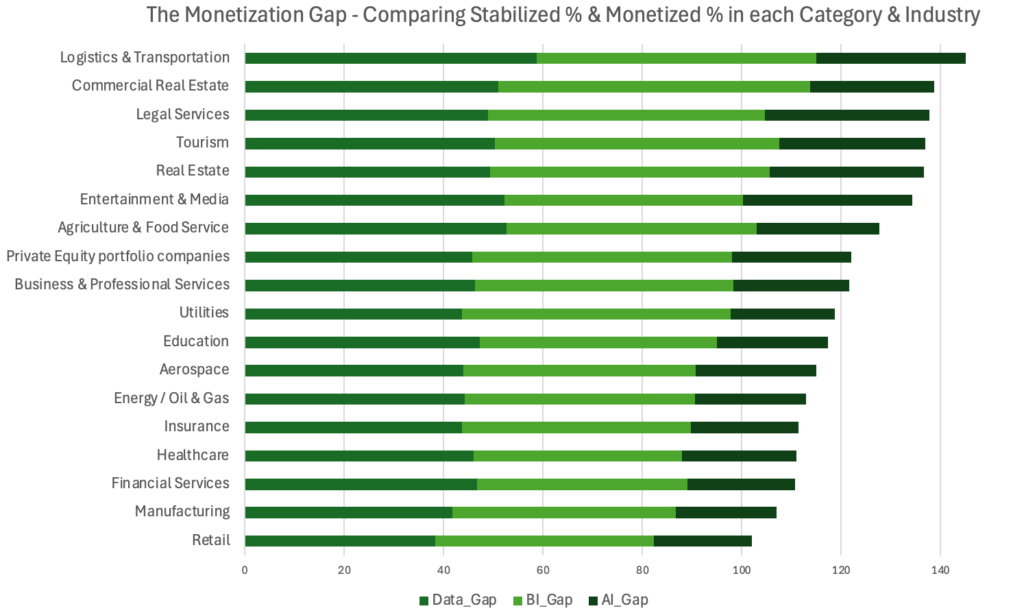
The implication for any mid-market executive reading this report; if your industry sits in the upper half of the gap chart, the competitive question is not whether to invest more in infrastructure but whether to operationalize the infrastructure you have already built. Logistics has stabilization rates above 90% across all bands; the missing piece is the shipper-facing data product, the embedded predictive model in load planning, the automation that turns dashboard signal into routing decisions.
What size does and does not do
Size lifts monetization in Data and BI but not yet in AI:
| Lift from $10M–$100M to $250M–$1B (Monetized) | Mean across industries |
|---|---|
| Data Monetized | +25.7 pts |
| BI Monetized | +26.1 pts |
| AI Monetized | +17.3 pts |
The asymmetry is meaningful. Scale advantages compound for Data and BI; larger mid-market companies have the FTEs, the budgets, and the tech governance bandwidth to push their warehouses and dashboards from stabilized infrastructure into monetized data products. AI lift is significantly smaller because even the largest mid-market companies are still in the pilot-to-production transition; the structural advantage of scale has not yet compounded into AI monetization the way it has for Data and BI.
The window for smaller mid-market companies ($10M–$100M) to catch up on AI is therefore wider than the window to catch up on Data or BI. Companies in the lower revenue band that move decisively on focused, high-ROI AI deployments (dynamic pricing in Retail, predictive maintenance in Manufacturing, denial prediction in Healthcare) can close the size gap on AI before it compounds against them.
The Real Governor on AI Monetization · The Cost of Being Wrong
The most striking cross-industry pattern in the AI dimension is that the industries with the richest data estates (Healthcare, Financial Services) sit mid-pack on AI monetization, while industries with less regulatory drag (Retail, Entertainment & Media, Tourism) lead. Healthcare ranks #1 in BI Monetized and #8 in AI Monetized; Financial Services ranks #2 in BI and #11 in AI.
The lesson is that for AI monetization specifically, what slows production deployment is not data quality, infrastructure maturity, or talent availability; it is the cost of being wrong. Where being wrong is expensive (clinical misdiagnosis, biased lending decisions, fair-housing violations), governance frameworks slow deployment. Where being wrong is cheap (a recommendation that doesn’t convert, a pricing model that misses, a chatbot response that disappoints), AI moves into production more quickly.
This pattern matters for any mid-market CXO planning AI investment; the binding constraint on AI ROI is rarely technical and rarely about data. It is about whether your organization’s regulatory and risk posture allows AI to fail tolerably in production. Industries that have built tolerance for AI failure (Retail, E&M, Tourism) are monetizing at 2-3x the rate of industries that have not (Healthcare, Financial Services).
What this means for mid-market CXOs
Across 18 industries and three dimensions, the 2026 benchmark surfaces a consistent message; the frontier is no longer working on stabilization. Cloud warehouses, dashboarding tools, and AI APIs have become table stakes. What separates leaders from laggards is the discipline to push infrastructure into monetization; to convert stabilized warehouses into shared data products with measurable ROI; to convert governed semantic layers into embedded operational decisions; to convert AI pilots into production deployments with managed model lifecycles.
The competitive consequence of staying at stabilization is no longer a gradual fall behind; it is a structural disadvantage that compounds. Retail’s 40% AI Monetization rate is not a number Healthcare or Financial Services can match in 2027 by buying more infrastructure; it is the result of years of deployment discipline, governance maturity, and tolerance for production AI failure. The companies that build those capabilities now will lead the 2028 and 2029 editions of this benchmark by margins their stabilization-focused peers cannot close.
Appendix · Benchmark Data by Industry
The three tables below consolidate the 2026 benchmark across all 18 industries we surveyed, on the Monetized stage of each maturity dimension (Data, BI, AI). Click any industry name to read the industry-specific analysis and view data on stabilization/optimization rates in addition to monetization.
Confidence Levels and limitations
Of the 486 cells in the benchmark, 24 carry High confidence, 322 Medium, and 140 Low. The lowest-confidence industries (Aerospace, Education, Legal Services with 11 Low-confidence cells each; Real Estate with 10) are sectors where public signal is sparse and inference depends more heavily on adjacent-industry calibration. The highest-confidence industries (Retail with 3 Low cells, Tourism with 4) are sectors with rich vendor disclosure, conference presence, and public case study material.
Variance is highest where stakes are highest. Median observed range across runs is 8-9 percentage points for Stabilized cells, 20-23 points for Optimized cells, and 19-24 points for Monetized cells. The frontier of the framework, where readers most want a precise answer, carries the most uncertainty. The published per-cell ranges should be read alongside the point estimates accordingly.
Version 2’s deterministic audit pass produced 7 PASS / 3 WARN / 0 FAIL across 10 coherence checks. The 8.7 / 10 overall quality score passed our threshold for publication-ready.
Data Maturity by Industry
This table shows the Monetized share of mid-market companies by industry and revenue band for data. As a reminder, the three-stage criteria are:
- Stabilized: central warehouse/lake with scheduled ETL and a starter data dictionary
- Optimized: daily refresh, catalog + glossary, and first MDM domain
- Monetized: enterprise-wide MDM, data products shared across functions, measurable ROI
Cells are percentages of companies in that industry / revenue band that have reached the Monetized stage. The Overall column is the unweighted mean across the three revenue bands; the Overall row at the bottom is the unweighted mean across all 18 industries for each band.
| Industry | $10M–$100M | $100M–$250M | $250M–$1B | Overall |
|---|---|---|---|---|
| Retail | 38% | 58% | 68% | 55% |
| Manufacturing | 41% | 53% | 67% | 54% |
| Insurance | 42% | 53% | 61% | 52% |
| Utilities | 35% | 52% | 63% | 50% |
| Energy / Oil & Gas | 36%* | 48% | 62% | 49% |
| Healthcare | 35% | 48% | 62% | 48% |
| Aerospace | 38%* | 48% | 58% | 48% |
| Financial Services | 38% | 48% | 58% | 48% |
| Private Equity | 32%* | 48% | 62% | 47% |
| Business & Professional Services | 32% | 48% | 61% | 47% |
| Entertainment & Media | 32% | 44% | 58% | 45% |
| Legal Services | 31% | 44% | 56% | 44% |
| Agriculture & Food Service | 28% | 42% | 54% | 41% |
| Tourism | 28% | 38% | 46% | 37% |
| Education | 22% | 37% | 51% | 37% |
| Logistics & Transportation | 19% | 35% | 48% | 34% |
| Commercial Real Estate | 18%* | 32% | 47% | 32% |
| Real Estate | 18% | 32% | 44% | 31% |
| Overall | 31% | 45% | 57% | 44% |
* Low-confidence cell: public signal on this particular value was scarce. Per our methodology, the value was estimated by adding adjacent sector information (neighboring revenue bands and analogous industries).
BI Maturity by Industry
This table shows the Monetized share of mid-market companies by industry and revenue band for BI (business intelligence). As a reminder, the three-stage criteria are:
- Stabilized: dashboards in place, weekly refresh, initial instrumentation
- Optimized: governed semantic layer, KPI catalog with owners, data literacy programs
- Monetized: predictive analytics, scenario planning, automated responses embedded in workflows
Cells are percentages of companies in that industry / revenue band that have reached the Monetized stage. The Overall column is the unweighted mean across the three revenue bands; the Overall row at the bottom is the unweighted mean across all 18 industries for each band.
| Industry | $10M–$100M | $100M–$250M | $250M–$1B | Overall |
|---|---|---|---|---|
| Healthcare | 41% | 52% | 68% | 54% |
| Financial Services | 41% | 52% | 64% | 52% |
| Retail | 42% | 52% | 63% | 52% |
| Manufacturing | 38% | 52% | 64% | 51% |
| Entertainment & Media | 38% | 50% | 62% | 50% |
| Insurance | 42% | 49% | 58% | 50% |
| Aerospace | 35%* | 48% | 61% | 48% |
| Energy / Oil & Gas | 32%* | 48% | 62% | 47% |
| Agriculture & Food Service | 28% | 48% | 59% | 45% |
| Business & Professional Services | 28% | 42% | 56% | 42% |
| Utilities | 28% | 42% | 54% | 41% |
| Education | 28% | 41% | 54% | 41% |
| Private Equity | 28% | 41% | 54% | 41% |
| Legal Services | 27% | 37% | 51% | 38% |
| Logistics & Transportation | 22% | 36% | 48% | 35% |
| Real Estate | 18% | 34% | 48% | 33% |
| Tourism | 18% | 31% | 48% | 32% |
| Commercial Real Estate | 16% | 28% | 45% | 30% |
| Overall | 31% | 44% | 57% | 43% |
* Low-confidence cell: public signal on this particular value was scarce. Per our methodology, the value was estimated by adding adjacent sector information (neighboring revenue bands and analogous industries).
AI Maturity by Industry
This table shows the Monetized share of mid-market companies by industry and revenue band for AI (artificial intelligence). As a reminder, the three-stage criteria are:
- Stabilized: pilots and early deployments, prompt libraries, basic guardrails
- Optimized: MLOps practices, model registries, evaluation frameworks, monitoring
- Monetized: production AI delivering ROI, fine-tuned models, measurable revenue or cost impact
Cells are percentages of companies in that industry / revenue band that have reached the Monetized stage. The Overall column is the unweighted mean across the three revenue bands; the Overall row at the bottom is the unweighted mean across all 18 industries for each band.
| Industry | $10M–$100M | $100M–$250M | $250M–$1B | Overall |
|---|---|---|---|---|
| Retail | 28% | 39% | 52% | 40% |
| Entertainment & Media | 18% | 28% | 42% | 29% |
| Tourism | 13% | 22% | 32% | 22% |
| Insurance | 12% | 19% | 27% | 19% |
| Energy / Oil & Gas | 6% | 18% | 32% | 19% |
| Manufacturing | 9% | 16% | 26% | 17% |
| Aerospace | 8%* | 14% | 24% | 15% |
| Legal Services | 8% | 14% | 23% | 15% |
| Healthcare | 9% | 14% | 22% | 15% |
| Financial Services | 5% | 13% | 26% | 15% |
| Business & Professional Services | 4% | 12% | 28% | 15% |
| Logistics & Transportation | 6% | 13% | 23% | 14% |
| Private Equity | 6%* | 13% | 22% | 14% |
| Education | 5%* | 12% | 18% | 12% |
| Real Estate | 7%* | 11% | 17% | 12% |
| Agriculture & Food Service | 4%* | 12% | 18% | 11% |
| Commercial Real Estate | 3%* | 11% | 19% | 11% |
| Utilities | 4% | 11% | 16% | 10% |
| Overall | 9% | 16% | 26% | 17% |
* Low-confidence cell: public signal on this particular value was scarce. Per our methodology, the value was estimated by adding adjacent sector information (neighboring revenue bands and analogous industries).