One of the most common questions we receive, and the basis of interest of many clients in our Tech Assessment services, is to compare their IT & AI capabilities and performance with their peers. As in years past, we’ve prepared this analysis to help guide CXOs leading organizations from $10M to $1B in revenue. Without question, the mid-market is the competitive band where maturity gaps translate fastest into wins and losses with the fast-accelerating adoption.
As a continuation of one of the more popular blog categories we’ve posted, this second installment in our annual review of Data, BI & AI maturity captures a mid-market that is moving forward with urgency. This third annual survey updates our view on how mid-market organizations ($10M–$1B in revenue) are progressing in their use of Data, BI, and AI. We continue to measure tech maturity into three levels:
- Stabilized: The basics are in place.
- Optimized: Capabilities are operationalized and governed.
- Monetized: Capabilities directly drive measurable ROI – cost savings &/or top-line revenue growth.
Methodology
Unlike many maturity surveys that rely on self-reported questionnaires from a small panel of respondents, this survey is built on a proprietary AI prediction model designed to capture and generalize patterns at scale.
Our model estimates maturity levels across Data, Business Intelligence (BI), and Artificial Intelligence (AI) by analyzing a broad set of real-world signals, rather than relying on subjective self-assessments. Specifically, the model draws from:
- Employee profile data: skills, certifications, and role descriptions across thousands of professionals, indicating organizational capability depth.
- Vendor announcements and case studies: public disclosures of system deployments, cloud migrations, analytics initiatives, and AI adoption programs.
- Technology partner ecosystems: integrations, platform partnerships, and implementation footprints across industries.
- Hiring patterns and job postings: demand signals for data engineers, data scientists, cybersecurity staff, and other critical roles.
- Regulatory filings and industry disclosures: where available, insights into technology initiatives disclosed in public reporting.
- News coverage and analyst reports: references to adoption of specific platforms, methodologies, and AI-driven products.
These signals are aggregated by our AI model to predict the likelihood that a company of a given size, sector, and geography has reached the Stabilized, Optimized, or Monetized stage of maturity – meaning that they show evidence of tech capabilities yielding the kind of benefits needed for each level. This done not require that they are “fully” monetized or optimized, but it indicates they are aware of, and seem to be aiming to achieve that level of maturity.
Because this approach draws on a much wider dataset than any traditional survey, it avoids the bias of self-selection and small sample sizes. The result is a statistically richer and more accurate picture of mid-market maturity – one that reflects the patterns of thousands of companies across industries rather than the anecdotal views of a limited group of respondents.
Industry labels in the data tables below are hyperlinked to a detailed analysis of each industry’s trends, positioning, and a spotlight example organization. Please explore the depths of this analysis to maximize relevant insights for your organization…
Key Differences Between 2024 and 2025
The 2025 survey reveals another year of rapid maturation across Data, BI, and AI in the mid-market. Stabilization has become nearly universal, optimization is entrenched, and monetization is now the marker separating leaders from laggards. Here are the ten most important year-over-year shifts:
1. Data monetization pushed past the halfway mark
In the $10–$100M band, monetization rose from 42% in 2024 to 44% in 2025, while in $100–$250M firms it jumped from 57% to 60%. Across all mid-market tiers, the average now exceeds 50%, making ROI from data a new baseline expectation.
2. Smaller firms improved their optimization
Among <$10M companies, optimized Data grew from 48% to 52%. That’s a notable four-point gain in just one year for the smallest organizations, and its evidence that governance, catalogs, and MDM are no longer reserved for larger firms.
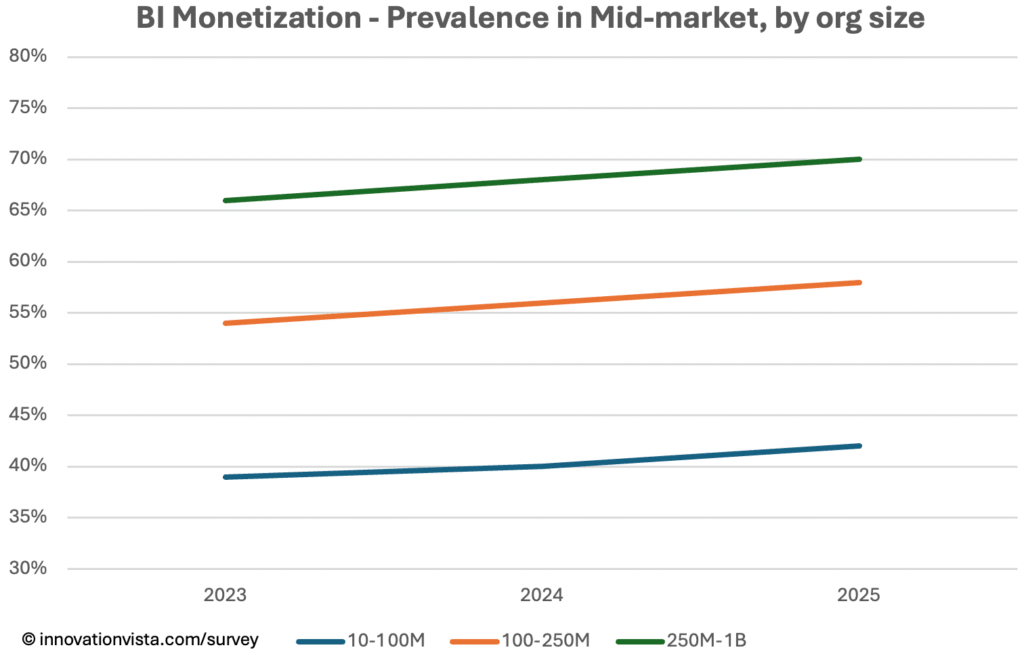
3. BI monetization surged into majority adoption
In $10–$100M firms, BI monetization climbed from 40% to 42%, and in $100–$250M firms from 56% to 58%. At $250M–$1B, monetization now sits at 70%, confirming that half of mid-market organizations have turned dashboards and KPIs into predictive, ROI-driving capabilities.
4. BI optimization is nearly maxed out
Optimization in $100–$250M firms hit 98%, leaving virtually no headroom. The few firms still stuck in “stabilized only” mode face steep disadvantages, as optimized BI has become a minimum standard.
5. AI stabilization broke through 75%
In $100–$250M companies, AI stabilization jumped from 66% to 75%, and in $250M–$1B firms from 82% to 89%. That’s nearly universal experimentation, meaning any firm not yet testing AI is visibly behind.
6. AI optimization is now the mid-market median
Optimization rates climbed sharply again: in $10–$100M firms from 31% to 38%, in $100–$250M from 41% to 55%, and in $250M–$1B from 60% to 69%. Over half of mid-market firms now run MLOps pipelines, model registries, and monitoring.
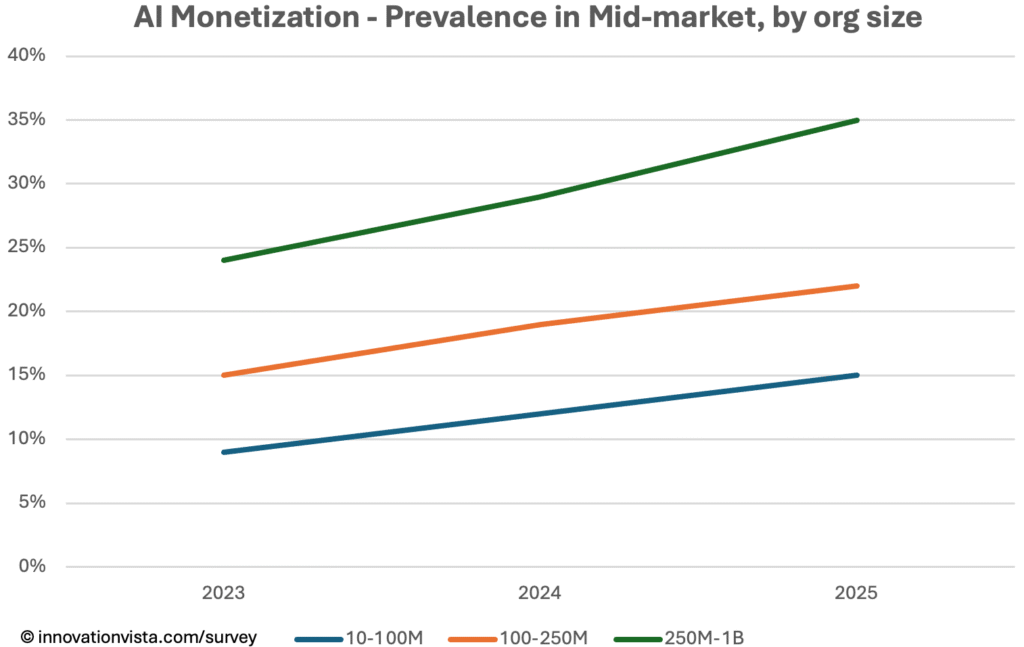
7. AI monetization doubled in larger mid-market firms
At $250M–$1B, monetization jumped from 29% in 2024 to 35% in 2025. While still early days, this level of growth signals that ROI from AI is becoming routine among scale players.
8. Retail and Entertainment are extending their lead
In $100–$250M Retail firms, AI monetization moved from 24% to 29%; in Entertainment from 22% to 27%. Both sectors continue to lead with embedded personalization, pricing, and content AI—threatening to disrupt peers that delay.
9. Real Estate and CRE continue to underperform
AI monetization in Real Estate barely budged, from 6% to 9% in $100–$250M firms. Commercial Real Estate is similarly stagnant at ~10–12% across tiers. These sectors remain the most vulnerable to new entrants that embrace AI to digitize transactions and customer experience.
10. The leader–laggard spread widened further
In AI monetization, the top quartile of industries (Retail, Entertainment, Financial Services, Insurance) now show 30–40% monetization at scale, while the bottom quartile (Real Estate, CRE, Education) sit in single digits. This gap is where disruption risk is sharpest.
Where laggards are most at risk:
The greatest threat remains in AI, where firms that have yet to optimize—or worse, have not stabilized—are no longer just behind, they are outliers. The risk is most acute in Real Estate, Commercial Real Estate, and Education, where single-digit monetization contrasts with peers already compounding ROI. In Data and BI, the new dividing line is monetization: sectors not converting data and analytics into revenue or margin gains risk becoming commoditized by those that are.
…and now for the Survey itself, beginning with the overall league table…
Overall Analytics Maturity Industry Ranking – 2025
| Rank | Industry | Weighted Score | Data Monetization (10-100M co’s) | BI Monetization (10-100M co’s) | AI Monetization (10-100M co’s) |
|---|---|---|---|---|---|
| 1 | Financial Services | 64.3 | 56% | 54% | 20% |
| 2 | Insurance | 63.7 | 55% | 54% | 18% |
| 3 | Retail | 63.0 | 44% | 54% | 22% |
| 4 | Entertainment & Media | 62.7 | 45% | 54% | 20% |
| 5 | Private Equity portfolio co’s | 62.3 | 51% | 54% | 20% |
| 6 | Utilities | 59.7 | 55% | 47% | 13% |
| 7 | Energy / Oil & Gas | 59.0 | 52% | 45% | 18% |
| 8 | Logistics & Transportation | 58.3 | 51% | 47% | 16% |
| 9 | Aerospace | 57.3 | 61% | 40% | 18% |
| 10 | Healthcare | 56.7 | 48% | 43% | 14% |
| 11 | Manufacturing | 55.7 | 46% | 43% | 15% |
| 12 | Tourism | 54.7 | 41% | 40% | 15% |
| 13 | Business & Professional Services | 50.0 | 41% | 39% | 12% |
| 14 | Agriculture & Food Service | 49.0 | 40% | 37% | 12% |
| 15 | Legal Services | 48.3 | 38% | 35% | 16% |
| 16 | Education | 43.7 | 34% | 29% | 8% |
| 17 | Commercial Real Estate | 41.7 | 37% | 33% | 6% |
| 18 | Real Estate | 41.0 | 36% | 30% | 6% |
Our notes & interpretation:
1. Financial Services, Insurance, Retail, and Entertainment dominate this competition. They are above 50% in both Data and BI monetization, and leading in AI. These sectors treat optimization as table stakes and are already compounding ROI. Slow movers in these verticals are running significant risks of disruption, loss of market-share, or worse unless they can catch up soon.
2. Private Equity portfolio companies are notable climbers, matching leading BI monetization rates and showing strong progress in Data monetization. In truth, PE firms can be considered a significant uplift engine for Tech & Analytics maturity for the mid-market as a whole. They would rank higher, but they frequently sell or IPO high-maturity organizations, and acquire new companies at the lower end of the spectrum. Climbing the Analytics maturity curve is where a good portion of Private Equity’s gains in recent years have been generated.
3. Aerospace is a unique outlier: it leads in Data monetization (61%) but lags in BI monetization (40%). This highlights the sector’s sensor-rich environment but slower adoption of predictive dashboards and automation.
4. Utilities, Healthcare, Manufacturing, and Energy/Oil & Gas form a strong middle tier: solid optimization, good progress in Data/BI monetization, but slower in AI monetization (13–18%).
5. The laggards – Education, Commercial and Residential Real Estate – are most exposed. Monetization rates for BI and AI remain in the teens or single digits. These industries risk disruption as peers in other verticals reach monetization levels three to five times higher, and innovations are already starting to cross-pollinate industries.
6. The spread is stark. Leaders are near 60% monetization; laggards sit below 10% in AI. The gap is where competitive advantage and disruption risk are sharpest.
In the detailed tables below, each cell shows Stabilized / Optimized / Monetized percentages for that industry/size cohort. < $10M and > $1B are included for context, but the spotlight remains on the mid-market.
Data Maturity — Stabilized / Optimized / Monetized (Overall: 97% / 88% / 50%)
Criteria
- Stabilized: central warehouse/lake with scheduled ETL and a starter data dictionary.
- Optimized: daily refresh, catalog + glossary, and first MDM domain.
- Monetized: enterprise-wide MDM, data products shared across functions, measurable ROI.

| Industry | < $10M | $10–$100M | $100–$250M | $250M–$1B | $1B+ |
|---|---|---|---|---|---|
| Aerospace | 92 / 64 / 32 | 100 / 94 / 61 | 100 / 100 / 80 | 100 / 100 / 85 | 100 / 100 / 90 |
| Financial Services | 94 / 69 / 34 | 100 / 96 / 56 | 100 / 100 / 72 | 100 / 100 / 80 | 100 / 100 / 88 |
| Utilities | 94 / 69 / 33 | 100 / 96 / 55 | 100 / 100 / 72 | 100 / 100 / 80 | 100 / 100 / 88 |
| Insurance | 93 / 67 / 33 | 100 / 95 / 55 | 100 / 100 / 72 | 100 / 100 / 80 | 100 / 100 / 88 |
| Oil & Gas / Energy | 91 / 61 / 27 | 100 / 93 / 52 | 100 / 100 / 68 | 100 / 100 / 77 | 100 / 100 / 86 |
| Logistics & Transportation | 92 / 64 / 31 | 100 / 94 / 51 | 100 / 100 / 67 | 100 / 100 / 75 | 100 / 100 / 84 |
| Private Equity portfolio co’s | 92 / 64 / 31 | 100 / 94 / 51 | 100 / 100 / 67 | 100 / 100 / 75 | 100 / 100 / 84 |
| Healthcare | 90 / 58 / 27 | 100 / 92 / 48 | 100 / 100 / 64 | 100 / 100 / 72 | 100 / 100 / 82 |
| Manufacturing | 89 / 56 / 25 | 100 / 91 / 46 | 100 / 100 / 62 | 100 / 100 / 72 | 100 / 100 / 82 |
| Entertainment & Media | 84 / 47 / 22 | 99 / 86 / 45 | 100 / 99 / 61 | 100 / 100 / 69 | 100 / 100 / 79 |
| Retail | 84 / 47 / 21 | 99 / 86 / 44 | 100 / 99 / 60 | 100 / 100 / 68 | 100 / 100 / 78 |
| Business Services | 80 / 42 / 18 | 98 / 82 / 41 | 100 / 99 / 57 | 100 / 100 / 66 | 100 / 100 / 76 |
| Tourism | 80 / 42 / 18 | 98 / 82 / 41 | 100 / 98 / 57 | 100 / 100 / 65 | 100 / 100 / 75 |
| Agriculture & Food Service | 78 / 39 / 17 | 98 / 80 / 40 | 100 / 98 / 55 | 100 / 100 / 65 | 100 / 100 / 75 |
| Legal Services | 78 / 39 / 16 | 98 / 80 / 38 | 100 / 98 / 54 | 100 / 100 / 63 | 100 / 100 / 73 |
| Commercial Real Estate | 76 / 36 / 15 | 98 / 77 / 37 | 100 / 98 / 52 | 100 / 100 / 61 | 100 / 100 / 71 |
| Real Estate | 74 / 33 / 14 | 97 / 75 / 36 | 100 / 97 / 51 | 100 / 100 / 60 | 100 / 100 / 70 |
| Education & EdTech | 72 / 31 / 13 | 97 / 72 / 34 | 99 / 97 / 50 | 100 / 100 / 58 | 100 / 100 / 68 |
| Average | 85 / 52 / 23 | 99 / 87 / 44 | 100 / 99 / 60 | 100 / 100 / 69 | 100 / 100 / 79 |
Data is now almost universal at the optimized level, with monetization breaking through the 50% mark in the mid-market. Strongest sectors are Financial Services, Insurance, Utilities, and Aerospace, while Education and Real Estate remain furthest behind in monetization despite steady progress in stabilization and optimization.
Analytics (BI) Maturity — Stabilized / Optimized / Monetized (Overall: 97% / 86% / 47%)
Criteria
- Stabilized: dashboards in place, weekly refresh, initial instrumentation.
- Optimized: governed semantic layer, KPI catalog with owners, data literacy programs.
- Monetized: predictive analytics, scenario planning, automated responses embedded in workflows.
| Industry | < $10M | $10–$100M | $100–$250M | $250M–$1B | $1B+ |
|---|---|---|---|---|---|
| Entertainment & Media | 93 / 67 / 31 | 100 / 96 / 54 | 100 / 100 / 70 | 100 / 100 / 80 | 100 / 100 / 90 |
| Insurance | 93 / 67 / 31 | 100 / 96 / 54 | 100 / 100 / 70 | 100 / 100 / 80 | 100 / 100 / 90 |
| Private Equity portfolio co’s | 93 / 67 / 31 | 100 / 96 / 54 | 100 / 100 / 70 | 100 / 100 / 80 | 100 / 100 / 90 |
| Retail | 93 / 67 / 31 | 100 / 96 / 54 | 100 / 100 / 70 | 100 / 100 / 80 | 100 / 100 / 90 |
| Financial Services | 93 / 67 / 31 | 100 / 96 / 54 | 100 / 100 / 70 | 100 / 100 / 80 | 100 / 100 / 90 |
| Logistics & Transportation | 91 / 61 / 27 | 100 / 94 / 47 | 100 / 100 / 65 | 100 / 100 / 76 | 100 / 100 / 86 |
| Utilities | 89 / 56 / 23 | 100 / 92 / 47 | 100 / 99 / 64 | 100 / 100 / 76 | 100 / 100 / 86 |
| Oil & Gas / Energy | 86 / 50 / 22 | 99 / 89 / 45 | 100 / 99 / 62 | 100 / 100 / 74 | 100 / 100 / 84 |
| Aerospace | 87 / 53 / 22 | 100 / 91 / 40 | 100 / 99 / 60 | 100 / 100 / 72 | 100 / 100 / 82 |
| Tourism | 87 / 53 / 22 | 100 / 91 / 40 | 100 / 99 / 60 | 100 / 100 / 72 | 100 / 100 / 82 |
| Healthcare | 84 / 47 / 20 | 99 / 88 / 43 | 100 / 99 / 60 | 100 / 100 / 72 | 100 / 100 / 82 |
| Manufacturing | 84 / 47 / 20 | 99 / 88 / 43 | 100 / 99 / 60 | 100 / 100 / 72 | 100 / 100 / 82 |
| Business Services | 78 / 39 / 16 | 99 / 82 / 39 | 100 / 97 / 54 | 100 / 100 / 65 | 100 / 100 / 75 |
| Agriculture & Food Service | 74 / 33 / 14 | 97 / 77 / 37 | 100 / 96 / 52 | 100 / 100 / 63 | 100 / 100 / 73 |
| Legal Services | 69 / 28 / 12 | 97 / 72 / 35 | 100 / 94 / 51 | 100 / 100 / 62 | 100 / 100 / 72 |
| Commercial Real Estate | 67 / 26 / 11 | 96 / 69 / 33 | 100 / 93 / 49 | 100 / 100 / 60 | 100 / 100 / 70 |
| Real Estate | 64 / 24 / 10 | 95 / 66 / 30 | 100 / 91 / 47 | 100 / 99 / 58 | 100 / 100 / 68 |
| Education & EdTech | 61 / 22 / 9 | 94 / 63 / 29 | 100 / 90 / 46 | 100 / 99 / 57 | 100 / 100 / 67 |
| Average | 82 / 45 / 20 | 99 / 86 / 42 | 100 / 98 / 58 | 100 / 100 / 70 | 100 / 100 / 80 |
BI continues to be universal across the mid-market, with optimization essentially complete by $100M. Monetization shows meaningful progress, with about half of mid-market firms embedding BI directly into workflows to drive revenue or reduce costs. Strongest sectors include Financial Services, Retail, Insurance, and Entertainment, while Education, Real Estate, and CRE still show much lower monetization rates.
AI Maturity — Stabilized / Optimized / Monetized (Overall: 75% / 55% / 25%)
Criteria
- Stabilized: pilots and early deployments, prompt libraries, basic guardrails.
- Optimized: MLOps practices, model registries, evaluation frameworks, monitoring.
- Monetized: production AI delivering ROI—fine-tuned models, measurable revenue or cost impact.
| Industry | < $10M | $10–$100M | $100–$250M | $250M–$1B | $1B+ |
|---|---|---|---|---|---|
| Retail | 67 / 43 / 16 | 77 / 53 / 22 | 87 / 67 / 29 | 96 / 84 / 43 | 100 / 97 / 63 |
| Financial Services | 62 / 38 / 14 | 73 / 47 / 20 | 84 / 61 / 27 | 95 / 80 / 40 | 100 / 96 / 60 |
| Entertainment & Media | 62 / 38 / 14 | 73 / 47 / 20 | 84 / 61 / 27 | 95 / 80 / 40 | 100 / 96 / 60 |
| Private Equity portfolio co’s | 62 / 38 / 14 | 73 / 47 / 20 | 84 / 61 / 27 | 95 / 80 / 40 | 100 / 96 / 60 |
| Aerospace | 60 / 35 / 12 | 70 / 45 / 18 | 82 / 58 / 25 | 94 / 78 / 38 | 99 / 95 / 55 |
| Insurance | 60 / 35 / 12 | 70 / 45 / 18 | 82 / 58 / 25 | 94 / 78 / 38 | 99 / 95 / 55 |
| Oil & Gas / Energy | 60 / 35 / 12 | 70 / 45 / 18 | 82 / 58 / 25 | 94 / 78 / 38 | 99 / 95 / 55 |
| Logistics & Transportation | 57 / 33 / 11 | 68 / 42 / 16 | 80 / 56 / 23 | 93 / 76 / 35 | 99 / 94 / 52 |
| Legal Services | 57 / 33 / 11 | 68 / 42 / 16 | 80 / 56 / 23 | 93 / 76 / 35 | 99 / 94 / 52 |
| Tourism | 55 / 31 / 10 | 66 / 39 / 15 | 78 / 53 / 21 | 92 / 73 / 32 | 99 / 93 / 50 |
| Manufacturing | 55 / 31 / 10 | 66 / 39 / 15 | 78 / 53 / 21 | 92 / 73 / 32 | 99 / 93 / 50 |
| Healthcare | 52 / 29 / 10 | 63 / 37 / 14 | 76 / 50 / 22 | 90 / 70 / 33 | 99 / 92 / 50 |
| Utilities | 52 / 29 / 9 | 63 / 37 / 13 | 76 / 50 / 21 | 90 / 70 / 33 | 99 / 92 / 50 |
| Agriculture & Food Service | 45 / 23 / 8 | 55 / 30 / 12 | 69 / 42 / 18 | 86 / 62 / 28 | 98 / 88 / 45 |
| Business Services | 45 / 23 / 8 | 55 / 30 / 12 | 69 / 42 / 18 | 86 / 62 / 28 | 98 / 88 / 45 |
| Education & EdTech | 35 / 16 / 6 | 45 / 21 / 8 | 58 / 31 / 12 | 78 / 50 / 20 | 95 / 80 / 38 |
| Commercial Real Estate | 31 / 13 / 5 | 37 / 16 / 6 | 50 / 24 / 10 | 70 / 41 / 16 | 92 / 72 / 32 |
| Real Estate | 31 / 13 / 5 | 34 / 14 / 6 | 47 / 22 / 9 | 68 / 38 / 15 | 91 / 69 / 30 |
| Average | 53 / 30 / 10 | 63 / 38 / 15 | 75 / 55 / 22 | 89 / 69 / 35 | 98 / 91 / 52 |
AI is where the mid-market is advancing most rapidly. Three-quarters of companies have stabilized AI, more than half have optimized, and about one in four are monetizing. The leaders are Retail, Entertainment, and Financial Services, all with monetization rates near or above 30% in the mid-market. Real Estate, CRE, and Education remain at the bottom, though even they show incremental progress. The spread between smaller and larger firms persists, but monetization is rising across every sector.
Take-aways for Mid-market CXOs
This year’s survey shows a mid-market that has cemented optimized Data and BI as universal standards and is rapidly advancing into monetized AI. Stabilization is complete, optimization is widespread, and monetization is now the dividing line between leaders and laggards.
CXOs should take note: firms already monetizing AI, BI, and Data are widening the gap, compounding ROI and grabbing territory at the top end of enterprise valuations. These tech-forward companies have the innovation flywheel spinning at full speed now, and they are setting a pace that others must match quickly – or risk being disrupted and forced to sell for the value of their customer lists, or worse.
Also reported by EIN Presswire