The modern enterprise is rarely short on ideas. In the age of digital transformation, the bottleneck to innovation is usually not a lack of imagination, but the absence of a structured Project Portfolio Management (PPM) process to evaluate and prioritize those ideas. Many organizations fall into the trap of “divergent thinking” in perpetuity – constantly identifying new possibilities without narrowing them down into a functional roadmap. This leads to “analysis paralysis” gridlock, where resources are spread too thin and/or leadership becomes a bottleneck to progress.
The Project Vista methodology provides a decisioning framework for organizations which have spent sufficient time in “divergent thinking” to have too many project ideas to implement at once. It pivots the thought process toward “convergent thinking“, providing a disciplined approach to selecting projects that offer the highest near- and long-term impact relative to the firm’s unique constraints.
The Challenge of Innovation Triage · Why IT Projects Fail Early
The analysis of potential projects is a notoriously challenging exercise in Information Technology for several recurring reasons:
- Uniqueness: Projects are unique and often envisioned by different teams or departments, making “apples-to-apples” comparisons difficult.
- Political dynamics: Often the projects supported by the most powerful executive(s) or department(s) are approved, even against higher-ROI alternative(s) which simply lack a vocal sponsor.
- The Chicken & Egg of Design/Decisioning: Fleshing out a project plan requires significant time from both IT and business units, yet it is only after this analysis that a clear view of implementation costs and benefits is formed.
- Mixed Goals: Organizations struggle to weigh projects aimed at efficiency against those focused on revenue growth, matching competitors, or compliance.
- Downstream ROI: Traditional financial models often ignore follow-on ROI – the way one project creates capabilities that shorten the distance to other goals downstream.
- Isolation Bias: Decisions are often made in isolation – “does this project make sense?” – ignoring the span-of-control limitations which often become the make-or-break element of the project, as implementation must be overseen by IT leadership team already responsible for day-to-day operations and existing projects.
The Components of the Project Vista Score
To move beyond the approach where the most influential or loudest groups get their proposals accepted, Project Vista utilizes a multi-dimensional matrix.
1. Estimated Costs
A reasonable estimate for project costs is critical for the ROIC and score math. If the solution is custom and doesn’t have a “list price”, these estimates are “T-shirt sized” using details from the most similar project(s) into which Innovation Vista or our client have visibility.
2. Estimated Efficiencies/Compliance
Likewise, efficiencies are an important component of the equation. Allowing for “human in the loop” (HitL) quality control is an important aspect of many types of automation, and when AI modeling is utilized.
3. Estimated Revenue/Market-share
New revenue streams are the most difficult component of the equation to determine; as a stand-in for market & pricing research, a “T-shirt size” estimate is usually best grounded coming from the client’s revenue operations (RevOps) &/or sales teams.
Quantifying the “T-Shirt” Estimates
Utilizing “T-shirt” sizing for initial estimates speeds key triage decisions to obtain directional insights about which projects deserve more in-depth analysis. This approach balances the need for quantifiable estimates in order to categorize project options with a cost- and time-sensitive method. By driving to quantifiable results, comparisons across potential projects of different types, complexities, and impacts can be evaluated and categorized against each other. Units of measure are adjustable for the context of the organization, but for many of our mid-size clients we use these:
| T-shirt Size | Efficiency Benefits (hours/day/user) | Revenue Gains (example $k) | IT/Vendor Effort (staff months) |
| XS | 0.25 | 25 | 1 |
| S | 0.5 | 60 | 2.5 |
| M | 1 | 150 | 6 |
| L | 2 | 400 | 15 |
| XL | 4 | 1,000 | 40 |
4. The Financial Basis (ROIC)
Project Vista uses Return on Invested Capital (ROIC) as its primary financial metric. By focusing on ROIC rather than simple cost, the methodology avoids unfairly preferring very small or very large projects based on the leadership’s risk appetite. This allows the organization to judge where investment of the company’s IT dollars will have the most impact.
5. Strategic Alignment “Bonus Factor”
To account for downstream benefits that traditional ROI misses, Project Vista applies a strategic bonus factor. This raises the calculated value for projects that align with core strategic initiatives or that bring follow-up benefits nearer. For example, client-facing capabilities are given a bonus factor by many organizations when they have a strategic goal of differentiating on the “client experience”.
6. Governors versus Platform Investments
A critical aspect of the Project Vista methodology is identifying intra-project relationships. We categorize these foundational projects into two types to clarify their strategic value:
- Governors: These are initiatives that block the firm’s ability to advance until they are completed. For example, data centralization is often a “governor” because the firm cannot launch high-impact AI or analytics without first breaking down data silos.
- Platform Investments: These initiatives act as “force multipliers” by creating a shared infrastructure that drops the future investment needed for subsequent projects. By reducing the “I” (Investment) in future ROI calculations, these platforms make previously out-of-reach projects feasible and raise their overall impact.
7. Span of Control Workload
Execution does not happen in isolation. Project Vista measures the span of control factor – the percentage of available oversight time each project would consume from IT leadership. This factor allows the organization to quantify the difference between projects that can be outsourced with oversight only versus those requiring intensive internal management.
The Project Vista Mathematical Model
To move beyond subjective decision-making, Project Vista employs a quantitative formula to calculate a “Project Vista Score” for every proposed initiative. This score recommends a project’s rank for consideration by balancing financial returns against the practical limits of management:
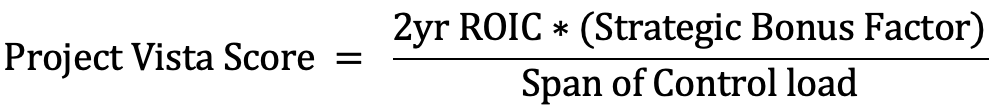
This equation ensures that the organization does not just blindly chase the highest return, but also prioritizes strategic alignment and accounts for the “management tax” each project levies on leadership. Even a high-ROIC project may be deprioritized if its span-of-control load is so high that it threatens to create a bottleneck for other vital initiatives.
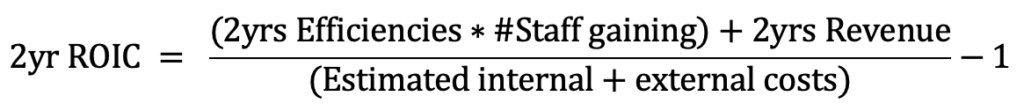
We calculate ROIC over a 2-year time-horizon in order to account for potential “ramp-up” realization of the benefits; we feel the 2-year horizon is more appropriate for the accelerating pace of change of the AI Revolution, but a more traditional 3-year analysis can certainly be used instead, per a client’s preference.
The Oversight Lifecycle · Accountability & Progressive Gating
Project Vista replaces the traditional “one-and-done” approval with a continuous cycle of executive oversight. This lifecycle ensures that leadership remains in the driver’s seat on strategic decisions without needing to manage daily technical tasks.
Phase 1 · Ideation and Initial Approval
The process begins with collaborative ideation between business units, IT, and consultants. Leadership provides an Initial Approval based on high-level impact analysis and T-shirt estimates. This approval does not fund the whole project; it only unlocks the resources for Phase 2.
Phase 2 · Design, Planning, and Commitment
During this phase, the project is “Planned and Designed”. The team must return with bottom-up work estimates involving dozens/hundreds of detailed components and a clear feasibility study. Once this detail is provided, estimate uncertainty is significantly reduced, and leadership gains confidence for full implementation funding.
Phase 3 · Iterative Execution and Accountability
As the project moves through sprints, testing, and change management, leadership maintains accountability via a final Completion Checkpoint. This ensures the virtuous cycle of innovation is completed and the projected ROI is actually realized.

Resourcing & Solution Options · Buy vs. Build vs. Rent
A core tenet of the Project Vista mindset is that not all innovation needs to be built from scratch. The methodology evaluates the ideal path for each project on the “Buy vs. Build vs. Rent” continuum:
- Renting Capacity/Capability: Use 3rd party “As a Service” solutions where possible to move faster by mitigating span of control limits.
- Branding the Result: Even when using 3rd party tools, the company should brand and differentiate these systems in their marketing if their configuration does form a strategic advantage.
- Behind the Curtain: We focus significant energy on analyzing “behind the curtain” internal systems that enable tailored service at scale, ensuring the organization’s unique value is felt by their customers even if the technology remains invisible to them.
Spinning Up a Virtuous Cycle
The Project Vista methodology is designed to build credibility and momentum. By wrapping quick-win enhancements with high immediate benefits into the broader roadmap, the organization can realize ROI early and build momentum.
Once these initial wins are realized, support for more complex, long-term project options rises, and the firm initiates a virtuous cycle of innovation. Innovation is no longer seen as a series of chaotic, isolated events, but as a disciplined, repeatable process that consistently delivers value.
Tech strategy itself is a high-ROI exercise given the light it sheds on these strategic opportunities. If your organization isn’t wrestling with these questions, you’re likely falling behind the companies which are.