How to Choose the Right Projects When Every Department Is Convinced Theirs Is the Right One
Every IT leader who has worked inside a mid-market organization knows the meeting. The conference room fills with department heads, each armed with a slide deck explaining why their project should be at the top of the roadmap. The CFO wants a financial reporting overhaul. The VP of Sales has been promised a CRM upgrade since last fiscal year. Operations is still waiting on the workflow automation that was supposed to ship eight months ago. And the CEO has been reading about AI and wants to know why the company isn’t moving faster.
Nobody is wrong exactly. All of these are real needs. But the organization cannot fund, staff, and execute all of them simultaneously; and without a disciplined framework for deciding, the decision defaults to whoever has the most organizational authority, the loudest voice, or the most patient persistence.
That is not a technology problem. It is a prioritization problem. And it produces the same outcome every time: resources spread too thin, delivery timelines slipping, leadership credibility eroding, and the highest-ROI projects often dying quietly because they lacked a powerful sponsor in that room.
Project Vista is Innovation Vista’s decisioning framework for organizations that have no shortage of ideas but do have a shortage of bandwidth. It brings objectivity to a conversation that is almost always political, forces implementation reality into an analysis that almost always ignores it, and generates a defensible, ranked portfolio rather than a negotiated compromise.
The Problem Is Not the Projects. It Is the Process for Choosing Between Them.
Organizations that struggle with project triage are not failing because they have bad ideas. They are failing because they are trying to compare fundamentally different things without a common unit of measure.
How do you weigh a compliance project that eliminates regulatory risk against a revenue initiative that might open a new market segment? How do you compare a quick-win automation that saves fifty hours a week against a foundational data infrastructure project that does nothing visible for nine months but makes every AI initiative afterward dramatically cheaper? How do you account for the fact that the project with the best projected ROI might consume so much IT leadership attention that it quietly derails three other initiatives running in parallel?
Traditional prioritization approaches cannot answer these questions. Most rely on one of two failure modes: a financial model that reduces every project to a simple ROI calculation (which ignores complexity, sequencing, and bandwidth), or a prioritization meeting where the ranking reflects executive politics more than business impact. Neither produces the right answer consistently.
The recurring traps are predictable:
Political dynamics override analytical rigor; the project with the most powerful sponsor advances regardless of its actual return.
Isolation bias treats each project as a standalone decision, ignoring that the organization’s IT leadership has a finite span of control that every project draws from.
The chicken-and-egg problem stalls decisions: you cannot estimate a project’s true cost and complexity without doing design work, but you cannot justify design work without a preliminary approval decision. Organizations oscillate between these two requirements indefinitely.
Downstream blindness treats every project as if its value begins and ends with itself, missing the way foundational investments reduce the cost of everything built afterward.
Project Vista is structured to address each of these failure modes directly.
The Core Insight · Implementation Difficulty Is a Multiplier, Not an Addition
Most prioritization formulas treat project cost and project complexity as separate line items. Project Vista treats them differently; implementation difficulty multiplies cost rather than adding to it.
The distinction matters more than it first appears. A project that is highly complex to execute does not just cost more in absolute terms; it consumes a disproportionate share of the organization’s finite leadership bandwidth, which raises the effective cost of every other project running simultaneously, and risks corner-cutting by, or burnout in, key leaders. A project that looks attractive in isolation can look very different once you account for the management tax it levies on the rest of the portfolio and on the organization.
This is the insight that most organizations are missing when projects underperform: the failure was often not in the project itself, but in the failure to account for what that project cost the broader portfolio and the organization while it ran, and the resulting resentment and internal resistance.
The Vista Score captures all of this in a single expression:

The numerator rewards the new efficiency and revenue the project directly produces, plus a probability-weighted term for the downstream investments the project makes cheaper or faster for other projects in the pipeline. The denominator penalizes the project for the investment it requires, scaled up by the combined implementation friction of disruption and oversight demands.
The square root on Disruption × Oversight is deliberate. In practice, disruptive projects almost always require more leadership oversight, so the two factors are partially correlated; multiplying them raw would double-penalize the same underlying difficulty. The geometric mean recognizes that they amplify each other without treating them as fully independent drags.
Estimating the Inputs · The T-Shirt Sizing Approach
Precise financial modeling at the ideation stage is expensive and slow; it also creates a false sense of accuracy on numbers that will change substantially once real design work begins. Project Vista uses a T-shirt sizing approach to generate directional estimates that are good enough for early triage without requiring full project planning as a prerequisite.
This approach collapses the chicken-and-egg problem: instead of needing a detailed cost estimate before you can prioritize, and needing a prioritization decision before you can justify the work to build that estimate, T-shirt sizing gives leadership enough signal to make a first-pass ranking decision and identify which projects warrant deeper analysis.
Each input to the Vista Score is assigned a T-shirt band, and each band maps to a numerical score on an exponential scale:
| T-shirt Size | Score | Relative Magnitude |
|---|---|---|
| XS | 1 | Baseline |
| S | 3 | 3× XS |
| M | 9 | 3× S |
| L | 27 | 3× M |
| XL | 81 | 3× L |
The exponential spacing is intentional. Project attractiveness does not scale linearly; the difference between a small project and a large one is not one step, it is an order of magnitude. Linear scoring systematically flattens those differences and makes the framework insensitive to the thing that actually matters most: separating the handful of initiatives with transformative return from the many with incremental return.
For mid-market organizations in the $250M to $500M revenue range, the bands translate to the following directional benchmarks:
| T-shirt Size | Efficiency (hours/day/user) | Revenue (example $k) | IT/Vendor Effort (staff months) |
|---|---|---|---|
| XS | 0.1 | 30 | 1 |
| S | 0.3 | 90 | 3 |
| M | 0.9 | 270 | 9 |
| L | 2.7 | 800 | 27 |
| XL | 8.0 | 2,400 | 81 |
Units are calibrated to the organization’s scale; the benchmarks above scale up or down for larger or smaller firms. The goal is not precision; it is comparability. By driving every proposed project to the same units of measure, the organization can rank a compliance initiative against a revenue initiative against an infrastructure investment without requiring that all three have fully baked financial models.
Benefit Components
Estimated benefits break into two categories. Efficiency benefits capture the time, labor, and cost reductions the project would generate; these are relatively straightforward to estimate, particularly for automation and integration projects. Revenue and market-share projections are harder to quantify from the IT side; for these, Project Vista relies on input from the client’s RevOps or sales leadership, who are better positioned to calibrate what a capability would actually move.
Financial Basis · ROIC Over a Two-Year Horizon
Project Vista uses Return on Invested Capital rather than simple ROI or payback period as its primary financial metric. ROIC normalizes across project size, so the framework does not systematically favor large or small projects based on leadership’s risk appetite. It measures where the organization’s technology investment dollars will generate the most impact per dollar deployed.
For both efficiencies and revenue, we calculate ROIC over a two-year horizon rather than the traditional three. That choice reflects the pace of the current AI era; a three-year projection assumes a stability in the competitive and technological landscape that no longer exists for most mid-market organizations, and with heightened velocity comes heightened opportunities, so the ROI bar should be higher. Clients who prefer a more conservative three-year model can apply that instead without changing the framework’s structure.
Governors and Platform Investments · Pricing In Downstream Value
One of the most common errors in project prioritization is evaluating every initiative as if it stands alone. It does not. Certain projects are not valuable primarily for what they deliver directly; they are valuable because they unlock or accelerate everything that comes after them.
Project Vista distinguishes two categories of foundational investment:
Governors are initiatives that block meaningful progress on higher-value projects until they are completed. Data centralization is the most common governor in mid-market organizations: you cannot build high-impact AI or analytics capabilities on top of siloed, inconsistent data. No matter how good your AI ambitions are, a governor that sits upstream of them controls your actual ceiling. Governors often look underwhelming on a standalone ROIC calculation; their true value is the bottleneck they remove.
Platform Investments act as force multipliers. Rather than blocking specific initiatives, platform investments reduce the investment required for every subsequent project that runs on top of them. A shared integration layer, a data warehouse, a consolidated identity platform – these create infrastructure that makes previously out-of-reach projects not just feasible, but dramatically cheaper and faster to execute. Platform investments often have modest direct returns but compounding downstream value that a project-by-project analysis will systematically undercount.
The Σ ( Prob% × ΔInvestment ) term in the Vista Score numerator is how the framework prices this downstream value in directly. For each downstream project the subject investment enables or accelerates, the analyst estimates two things: the probability that the downstream project will actually be undertaken (Prob%), and the investment reduction the subject project will produce for it (ΔInvestment). The probability weighting matters; not every downstream project survives strategic review, and counting the full downstream savings of initiatives that will never actually be funded overstates the value of the foundational work.
This is a more disciplined treatment than traditional prioritization allows. Rather than applying a subjective bonus for projects that “seem strategic”, the framework forces explicit estimates of both which downstream projects benefit and how likely those projects actually are. Governors and platform investments earn their place in the ranking on the strength of quantified, probability-weighted downstream math, not on strategic hand-waving.
Organizational Disruption & Oversight Span of Control · The Real Factors Everyone Ignores
The most distinctive elements of the Project Vista methodology are the two variables that most traditional frameworks omit entirely: how much a project will disrupt the organization during implementation, and how much of IT leadership’s finite oversight capacity it will consume while it runs.
Most prioritization conversations stop at budget and projected return. Both of those matter. But they describe a project in isolation, as if it exists in a vacuum separate from the people who have to implement it and the organization that has to absorb it. That is precisely where the model breaks down in practice.
Organizational disruption measures the change management load a project places on the business. A new ERP implementation and a backend infrastructure upgrade may carry similar budget figures, but they impose radically different demands on employees, department heads, and operational continuity. Projects that require extensive retraining, process redesign, or behavioral change across large populations of users carry a disruption cost that never appears in a standard ROI calculation, but which shows up immediately in productivity dips, resistance, delayed adoption, and the organizational goodwill burned managing the transition. High-disruption projects are not bad projects; they are projects that require honest accounting of what they actually cost, including the requisite change management.
Oversight span of control measures how much of IT leadership’s available attention a project will consume. Implementation does not happen in isolation from everything else the organization is running. Every project draws on the decision-making bandwidth, escalation capacity, and active management time of the same small group of people who are simultaneously responsible for day-to-day operations, existing commitments, and the stability of systems that cannot go down. Span of control is the measurement of how much of that finite capacity a given project claims.
A project that requires intensive internal management does not just cost more in budget terms; it becomes a drag on every initiative running in parallel. High-span projects are the hidden reason portfolios slow down: the bottleneck is rarely a technical problem; it’s that the same two or three people are being pulled in eight directions simultaneously, and nobody modeled that when the project was approved. The meter is running and the vendor can blame delays on “limited availability of key stakeholders”. Result: over budget. Because it was set with one eye shut.
In the Vista Score, both of these factors sit in the denominator alongside investment, combined under a square root to reflect their partial correlation. A project that is expensive, highly disruptive, and oversight-intensive is not three times harder than a clean, self-contained initiative; it is an order of magnitude harder, and the portfolio feels that difference acutely.
Making these factors explicit changes the prioritization conversation in a useful way. A project with excellent ROIC potential may still rank below a less financially impressive initiative if its disruption load and oversight demands would create a portfolio-wide bottleneck. Conversely, projects that can be executed with limited organizational disruption and light leadership oversight (or outsourced with oversight only) move up the ranking precisely because they preserve the two resources that are almost always the actual constraint: people’s capacity to change, and leadership’s capacity to manage.
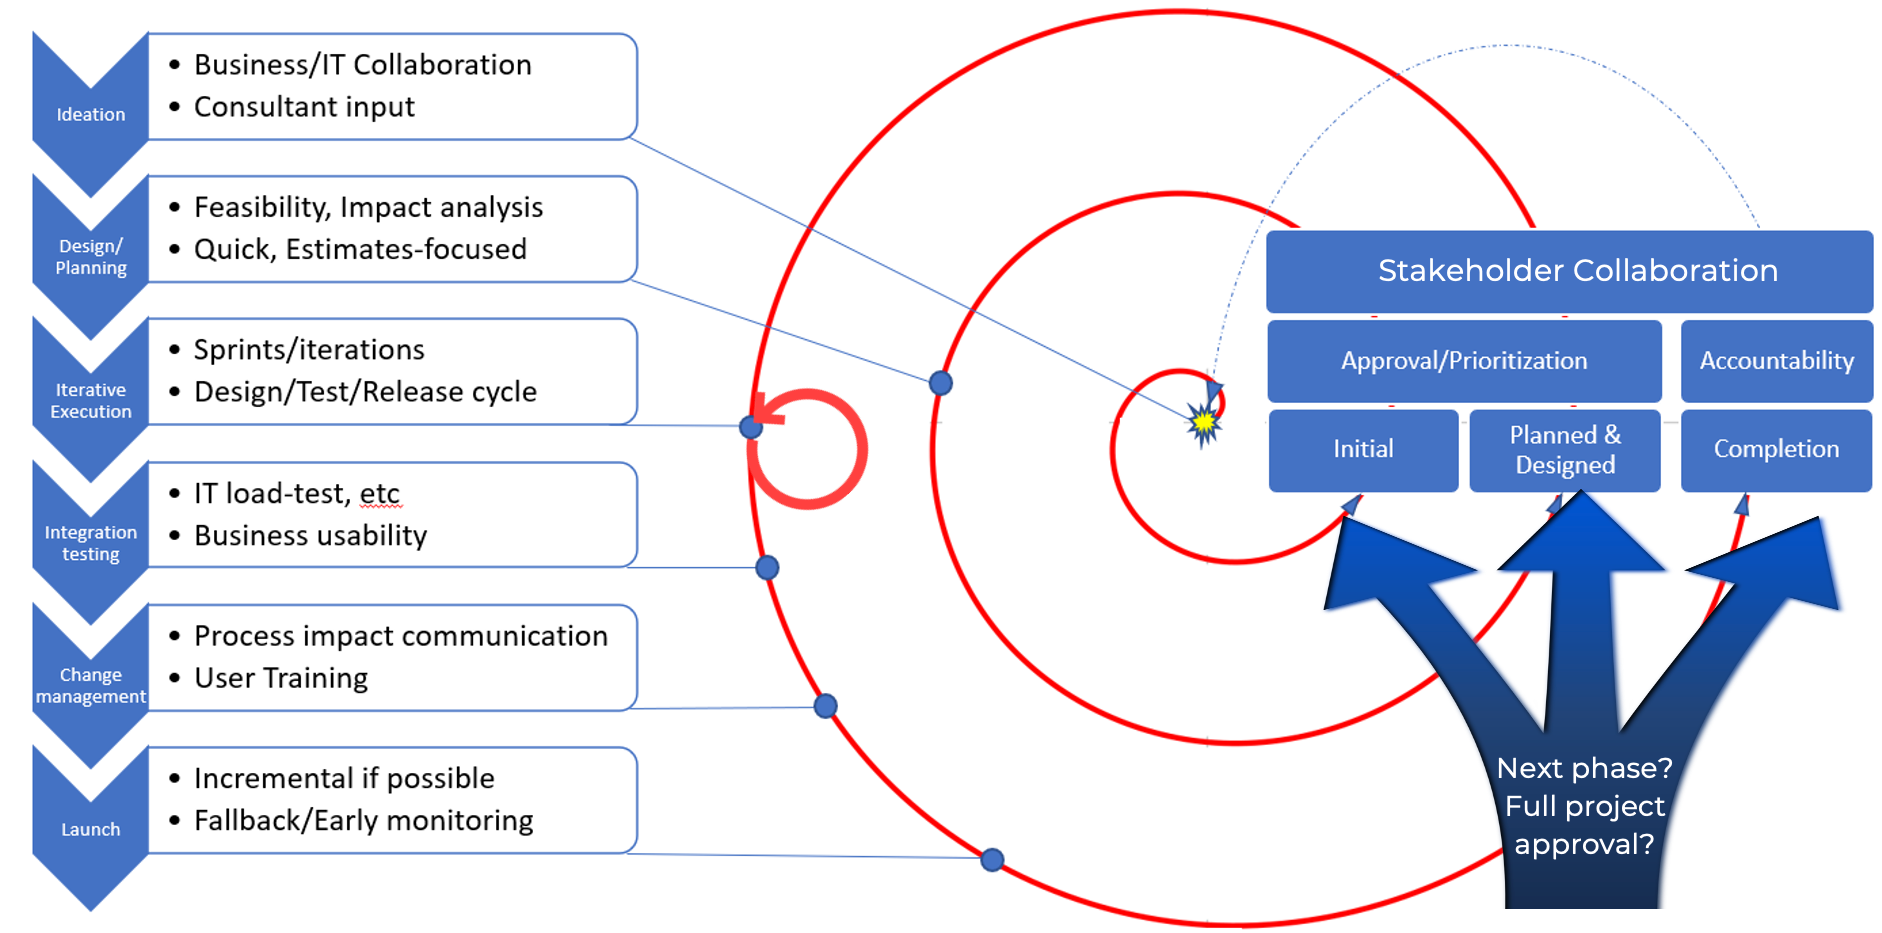
The Oversight Lifecycle · Accountability Without Micromanagement
Project Vista replaces one-time approval decisions with a structured three-phase oversight cycle. The purpose is to give leadership meaningful control over strategic decisions without pulling them into daily technical management.
Phase 1 · Ideation and Initial Approval
The process opens with collaborative ideation across business units, IT, and consultants where applicable. Leadership provides an initial approval based on T-shirt estimates and the Vista Score. This approval is not a funding commitment for full implementation; it is authorization to proceed to detailed planning. Keeping Phase 1 decisions limited in scope is what prevents the chicken-and-egg paralysis; leadership does not need a fully-baked plan to make an initial triage decision, and the organization does not need to invest full planning resources before getting a directional signal.
Phase 2 · Design, Planning, and Commitment
During Phase 2, the project team develops bottom-up work estimates from detailed component analysis and delivers a full feasibility study. This is where T-shirt estimates give way to real numbers. By the time leadership is asked to commit full implementation resources, the estimate uncertainty that plagues early-stage decisions has been substantially reduced. Leadership gains the confidence to fund execution because the work to validate the initial assumptions has already been done.
Phase 3 · Iterative Execution and Accountability
As the project moves through sprints, testing, and change management, leadership maintains accountability via completion checkpoints tied to the projected ROI milestones established in Phase 2. The goal of Phase 3 is not to re-litigate the project; it is to ensure the virtuous cycle completes – that the projected benefits are actually realized and documented, not just delivered in code and forgotten.
Where Project Vista Fits in the Stabilize→Optimize→Monetize Journey
Project Vista is primarily an Optimize-phase tool; it is most powerful in organizations that have achieved foundational IT stability and are now making deliberate choices about where to invest next. Organizations that are still firefighting daily – still in the Stabilize phase of the Stabilize→Optimize→Monetize framework – typically need to resolve that instability before a prioritization process can be productive. You cannot optimize what is not yet stable.
Once stability is achieved, Project Vista gives leadership the structured decision-making process to convert platform credibility into measurable business impact: identifying which efficiency investments to pursue, sequencing foundational work appropriately, and building the organizational confidence in IT execution that makes monetization-phase investments possible.
For organizations already optimizing and beginning to pursue revenue-generating and market-share initiatives, the Vista Score handles the shift naturally; revenue-producing projects earn larger ΔRevenue inputs, and customer-facing platform investments that enable a series of downstream monetization plays earn their place via the probability-weighted downstream investment term. The framework evolves with the organization’s maturity without requiring recalibration.
Building the Virtuous Cycle
The Project Vista methodology is designed to generate momentum, not just a ranked list. Quick-win projects with high near-term returns are not treated as distractions from strategic work; they are sequenced deliberately into the roadmap to generate early ROI, build stakeholder confidence in the process, and create the organizational appetite for more complex investments.
This is the virtuous cycle in practice: early wins demonstrate that the prioritization framework delivers results, which generates support for longer-horizon investments, which produce the foundational capabilities that make the next generation of initiatives possible at lower cost and higher impact. Innovation stops being a series of chaotic, politically negotiated decisions and becomes a repeatable, defensible process.
That shift changes the conversation in the conference room. When every project proposal enters a common framework with consistent inputs and a transparent score, the discussion moves from “whose project gets funded” to “what is the right sequence for maximum organizational impact”. That is a better meeting. And it produces better results.